How to discover disease- or antigen specificity-associated motifs
immuneML provides several different options for recovering motifs associated with antigen specificity or immune states. Depending on the context, immuneML provides several different reports which can be used for this purpose.
Discovering motifs learned by classifiers
KmerFrequency coefficients
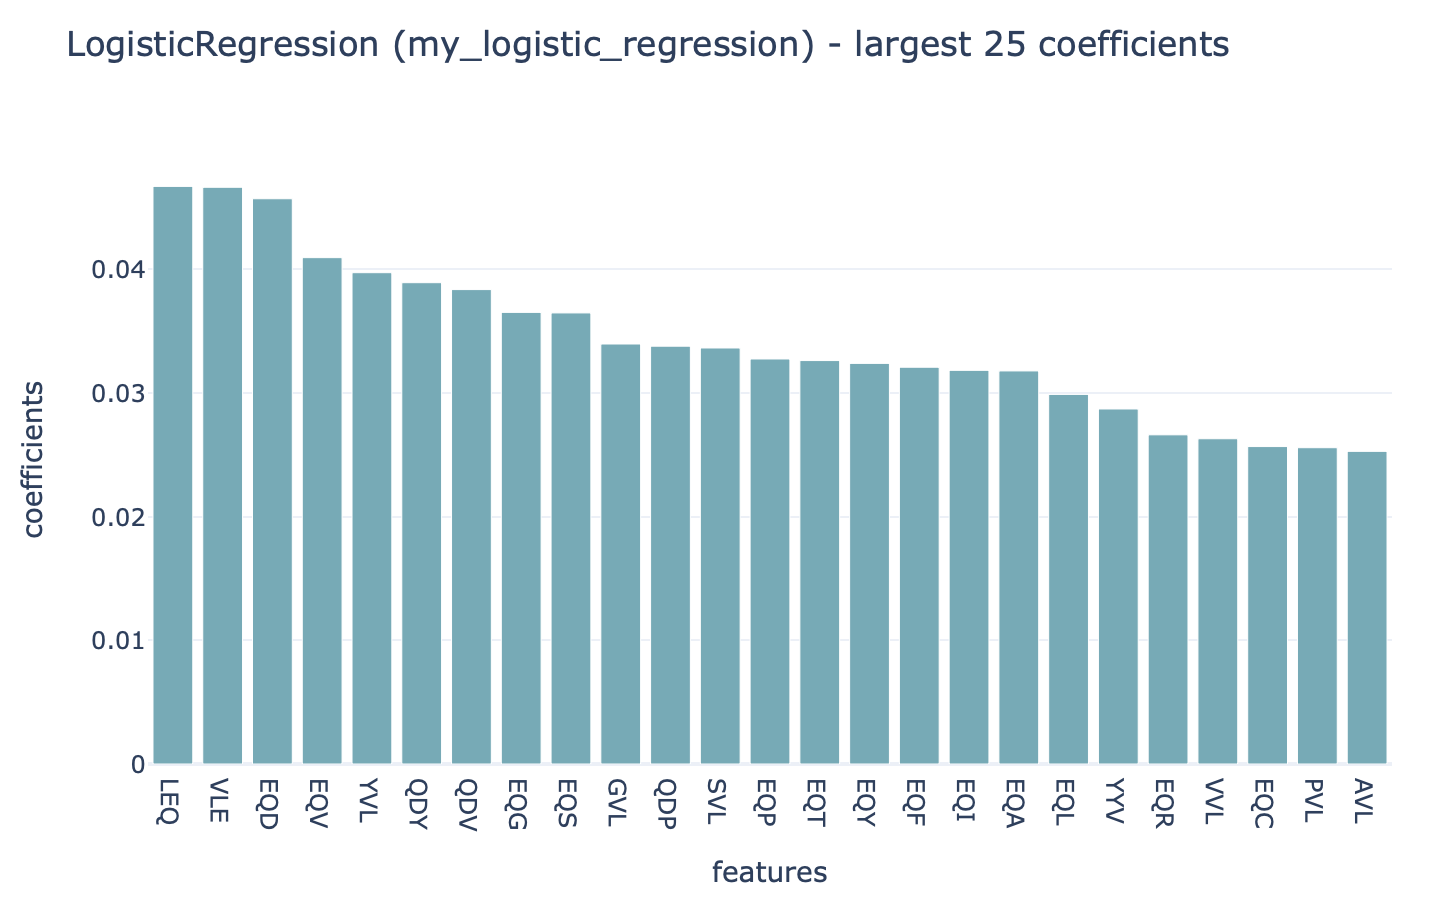
When using the KmerFrequency encoder in combination with LogisticRegression, SVM or RandomForestClassifier, a straightforward way to investigate which k-mer subsequences were learned to be important is by running the Coefficients report. To specify this type of analysis, see How to train and assess a receptor or repertoire-level ML classifier, where the Coefficients reports can be provided under TrainMLModel instruction, under selection:reports:models or assessment:reports:models. This can be applied to repertoire, receptor and sequence classification problems.
Strongly positive coefficients might indicate (partial) disease or antigen specificity-associated motifs. Consider the following example, where the ground truth implanted disease signal was ‘VLEQ’, the largest 3-mer encoding coefficients are associated with the subsequences ‘VLE’ and ‘LEQ’ which are contained inside ‘VLEQ’. Furthermore, subsequences that partially overlap with the disease signal, such as ‘EQD’, ‘EQV’ and ‘YVL’ are also associated with relatively large coefficients. Note that the coefficient size is not only determined by how important a subsequence is for determining an immune state or antigen specificity, but also other factors, such as the baseline frequency of subsequences in a dataset.
DeepRCMotifDiscovery for repertoire classification
When using the classifier DeepRC for a repertoire classification task, the report DeepRCMotifDiscovery can be used to investigate the learned patterns in the data. This report plots the contributions of input sequences and kernels to trained DeepRC model. These contributions are computed using integrated gradients (IG). The following two figures show examples of the DeepRCMotifDiscovery report outputs when training a DeepRC model on a dataset containing the artificial disease signal ‘VLEQ’. See How to train and assess a receptor or repertoire-level ML classifier for tutorial on how to write an instruction to perform this type of analysis (using TrainMLModel instruction and specifying the report under selection:reports:models or assessment:reports:models) and DeepRCMotifDiscovery for more information on the specific report.
The left figure shows the contributions of the characters within the input sequences of the test dataset for the immune status prediction of the repertoire. Blue indicates positive contribution, while red indicates negative contribution. Similarly, the right figure shows the 1D CNN kernels with the highest contribution over all positions and amino acids.
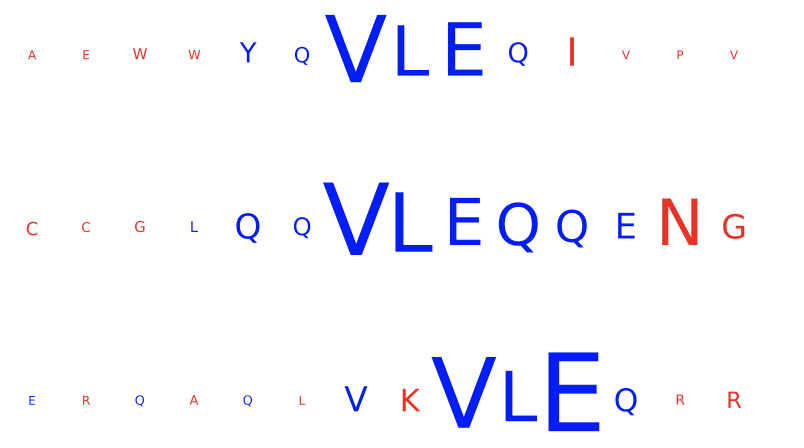

In this example, one kernel shows a strong signal for the subsequence ‘VLEQ’ while another shows a strong signal for ‘VLE’, which results in a strong positive contribution for the subsequence ‘VLE’ in the input sequences, with a relatively smaller (but still posxitive) contribution from the remaining ‘Q’.
TCRdistMotifDiscovery for receptor classification
For paired receptor datasets, the ML method TCRdistClassifier can be used in combination with the TCRdistMotifDiscovery report. This report hierarchically clusters paired immune receptor sequences based on the TCRdist3 distance metric, and for each of the clusters logo plots are created to uncover the motifs within the clustered receptors. See How to train and assess a receptor or repertoire-level ML classifier for running the TrainMLModel instruction (where TCRdistMotifDiscovery report can be provided under assessment:reports:models or selection:reports:models), and TCRdistMotifDiscovery report for more details on the report.
The figures below show examples of the logo plots of the TCRα (left) and TCRβ (right) chains. In this example, the subsequence ‘VLEQ’ has been implanted in the TCRβ chains, which can be seen in positions 4-7 in the logo plot on the right.


Recovering simulated immune signals
The Simulation instruction can be used to implant synthetic immune signals into AIRR datasets. Such immune signals can range from simple k-mers to collections of different k-mers with possible gap positions or stochastic hamming distance modifications.
The advantage of implanted immune signals is that the ground truth is known, meaning that the motifs learned by a classifier can be compared with the motifs that were originally implanted. When using the KmerFrequency encoder in combination with LogisticRegression, SVM or RandomForestClassifier, this comparison can be made using the MotifSeedRecovery report.
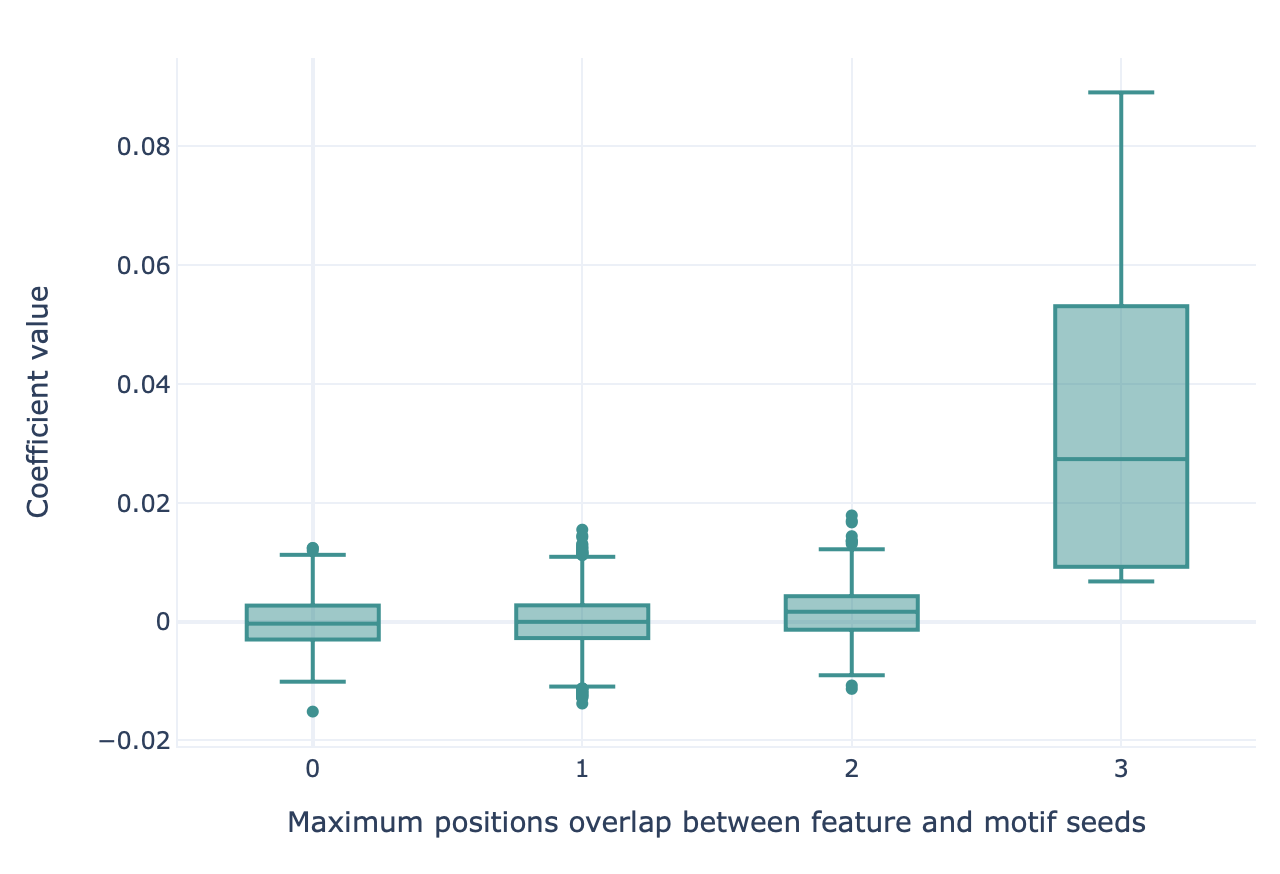
First, a maximum overlap score is calculated between each KmerFrequency feature (‘AAA’, ‘AAC’, …) and the implanted motif seeds. This score represents how well a given feature represents at least one of the motif seeds that comprise the ground truth signal. When calculating this overlap score, possible gap positions and hamming distance modifications are considered (see MotifSeedRecovery for details). The maximum overlap score between each feature and the motif seeds is determined using a sliding window approach. Therefore, the feature and motif seed do not have to have an equal length. The resulting overlap scores will be highest for features that completely match the motif seed, lower for features that partially match (for example ‘AAC’ and ‘ACC’ have at most 2 positions overlap), and lowest for features that do not represent any of the motif seeds.
Next, the features are grouped based on their maximum overlap scores. For each overlap score, a boxplot is made representing the coefficient value (LogisticRegression, SVM) or feature importance (RandomForestClassifier) for those features. If the classifier succeeded in learning the signal, the coefficient value or feature importance is highest for those motifs with a high overlap score.
For running this type of analysis, see How to train and assess a receptor or repertoire-level ML classifier for details on TrainMLModel instruction where the MotifSeedRecovery report should be provided directly under reports keyword in the instruction.
An example of what the output of the MotifSeedRecovery report looks like for a successful classifier is given here:
Comparing baseline motif frequencies in repertoires
Not every motif is equally likely to occur in the sequences of an immune repertoire. The variability of immune receptors is for example restricted by which V, D and J genes are present, among other factors. Using immuneML, we can investigate the baseline motif frequencies of immune receptor or repertoire datasets.
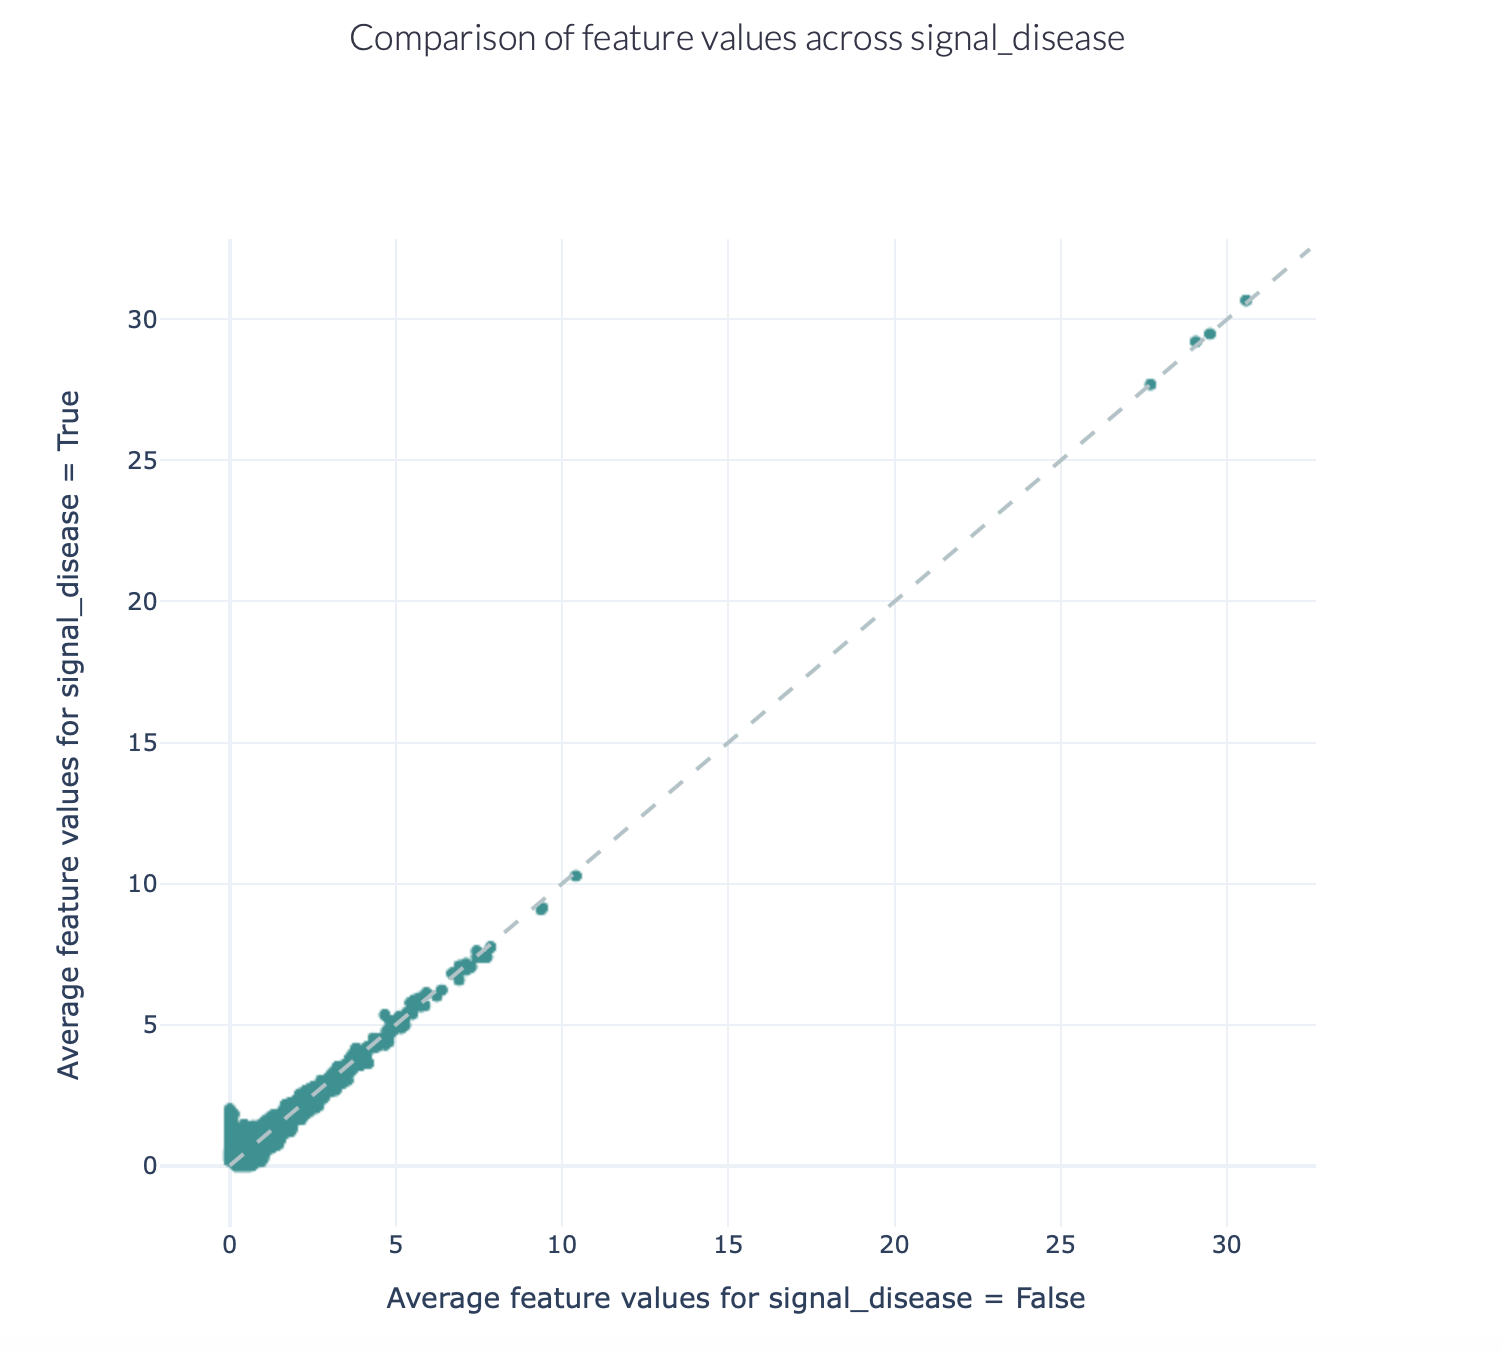
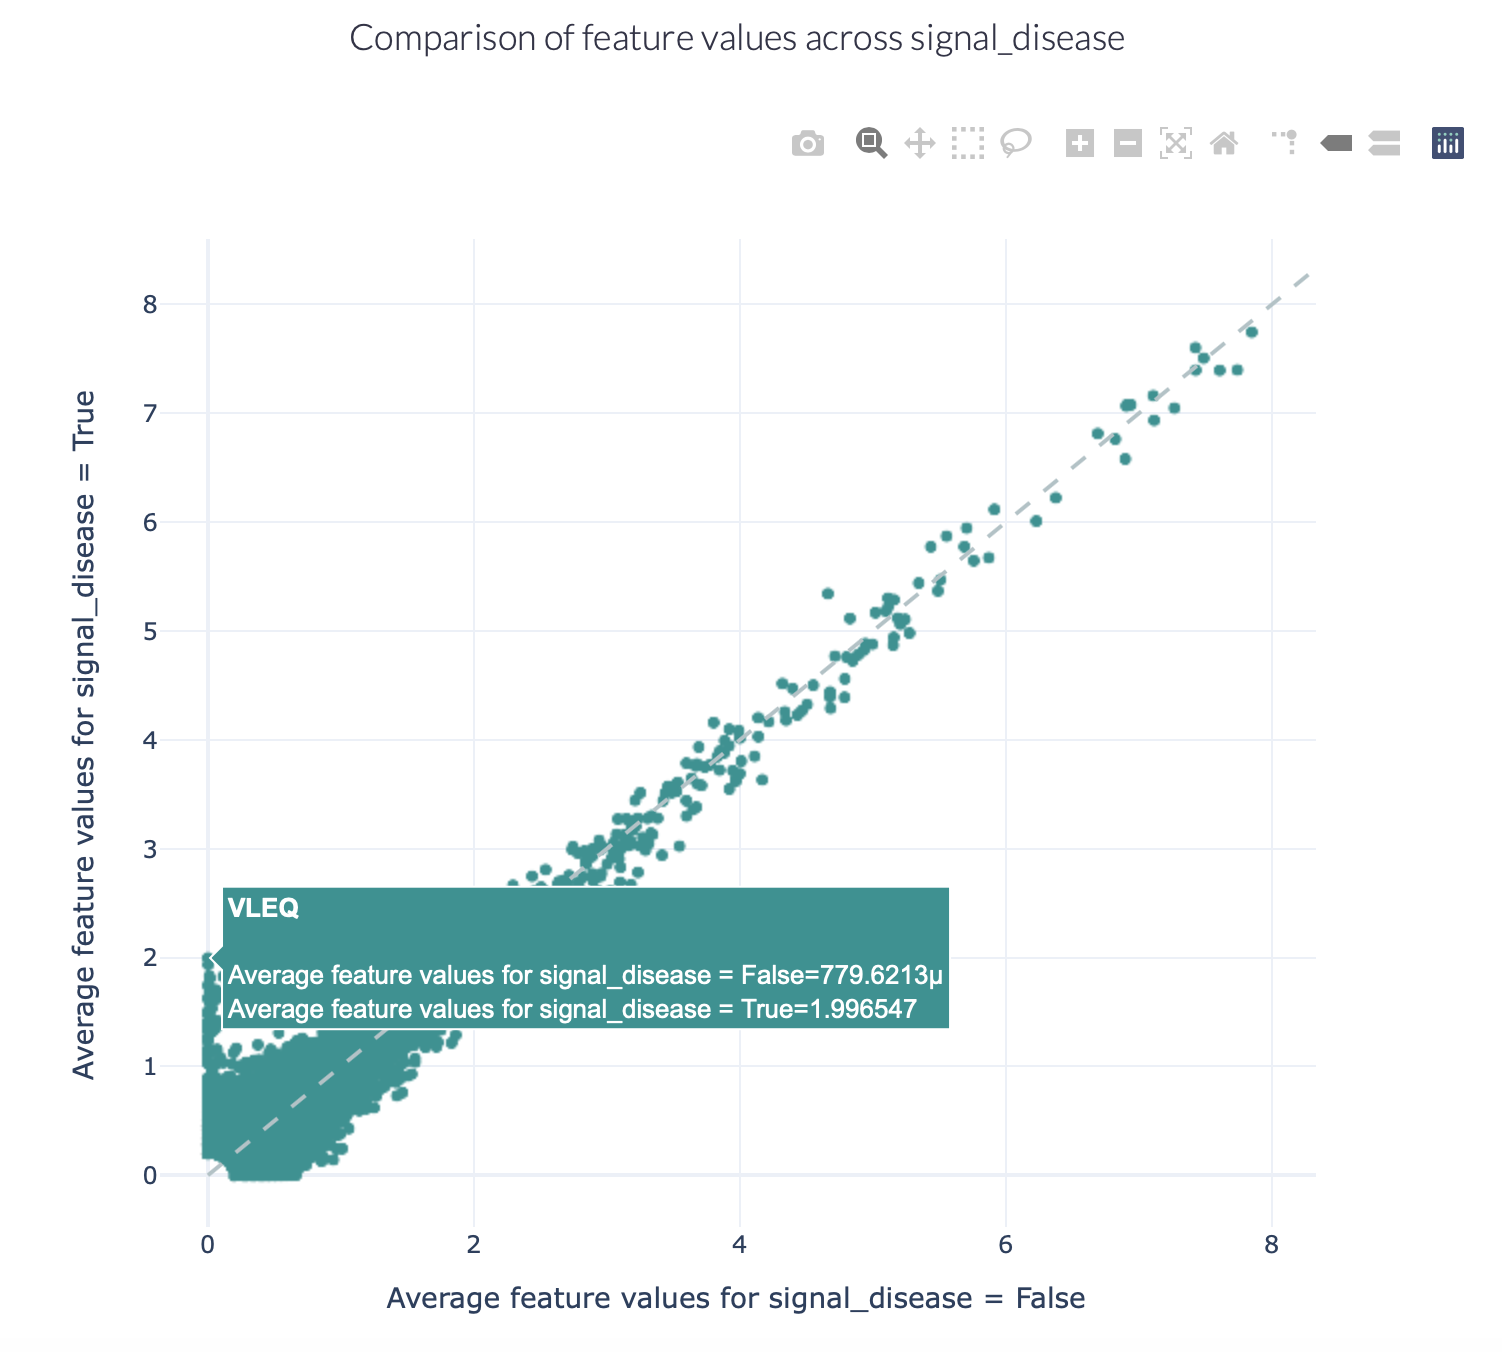
One method for comparing the baseline motif frequency distributions between different classes (e.g., sick versus healthy, or antigen binding versus non-binding) is by encoding the dataset using the KmerFrequency encoder, and generating a FeatureComparison report. This analysis can be executed using the ExploratoryAnalysis instruction, see How to perform an exploratory data analysis for more details.
The figures below show an example of the FeatureComparison report plot executed on the Quickstart dataset when encoded with a 4-mer frequency encoding. In this dataset, the synthetic disease signal ‘VLEQ’ was implanted. The figure on the left shows the complete plot, where it can be seen that there is a subset of 4-mers which occur at a higher frequency in the repertoires where the disease signal is present. The figure on the right shows the data from the same figure, but zoomed in on the left lower corner. The generated figure is interactive, and it is possible to hover over the points to reveal which feature they represent. As can be seen in the right figure, the feature ‘VLEQ’ appears more frequently in the repertoires where signal_disease = True.
Alternatively, when investigating the occurrence of more complex motifs in repertoire datasets, the MatchedRegex encoder can be used in combination with the Matches report. This will produce a table summarizing how often a set of regular expressions are matched in the sequences of the repertoire dataset.