Manuscript use case 1: Reproduction of a published study inside immuneML
In this use case, we show how the study by Emerson and colleagues on CMV status prediction from TCRbeta repertoires (Emerson et al. 2017) can be reproduced within immuneML. Additionally, we test the approach on datasets subsampled from the original study (to include randomly chosen 400, 200, 100 and 50 subjects) and estimate the performance of the approach when fewer examples are available.
The dataset was downloaded from Adaptive Biotechnologies’ website. Out of the 786 subjects (cohort 1: 666, cohort 2: 120), we removed 103 subjects from cohort 1 (1 with missing repertoire data, 25 with unknown CMV status, 3 with negative template counts for some of the sequences and the rest with no template count information).
The complete collection of original files used in this use case can be found in the NIRD research data archive (DOI: 10.11582/2021.00008). This also includes the metadata files for cohorts 1 and 2 with the list of subjects included in this use case. Note that the YAML specifications in the original dataset were compatible with immuneML version 1.0.1. This documentation page contains the YAML specifications for equivalent analyses with the latest immuneML version.
Reproduction of the CMV status predictions study
To reproduce the analysis, we used immuneML as a command line tool. We define the dataset to be used, data representation (encoding) which we call SequenceAbundance, the statistical model called ProbabilisticBinaryClassifier and different reports.
The encoding represents each repertoire by two numbers: the number of disease-associated sequences as determined by the Fisher’s exact test and the total number of sequences in the repertoire. As a hyperparameter of the encoding, it is possible to set the p-value threshold which can be used to determine which sequences are disease-associated. As in the original publication, we try out different p-value thresholds through cross-validation.
The statistical model ProbabilisticBinaryClassifier relies on SequenceAbundance encoding and fits two sets of parameters ({\(\alpha_0\), \(\beta_0\)} and {\(\alpha_1\), \(\beta_1\)}) to describe beta-distributed prior for CMV-negative and CMV-positive subjects. These parameters are then used to create log-posterior odds ratio for class assignment for new subjects.
Note
When used on large datasets, ‘SequenceAbundance’ encoder might be slow. If you want to reproduce the analysis faster and you are using immuneML version 2.2.0 or later, use CompAIRRSequenceAbundance encoder instead. p_value_threshold parameter is the same, and by default the analysis is performed using the amino acid sequence, and V and J genes. This can be turned of by setting ignore_genes to True (it is False by default).
To find the optimal p-value threshold we used 10-fold cross-validation on the cohort 1 and chose the one minimizing the cross-entropy loss (also called logarithmic loss). We then tested the performance of the optimal model (optimal p-value and the classifier fitted on resulting data representation) on the cohort 2 (as it was done in the original study).
The full YAML specification:
emerson_reproduction.yaml
definitions:
  datasets:
    cmv2017: # the full dataset including cohort 1 and cohort 2
      format: ImmunoSEQRearrangement
      params:
        path: ../emerson_adaptive/ # dataset files as provided by Adaptive Biotechnologies unzipped into emerson_adaptive folder
        metadata_file: cmv_metadata.csv # metadata file including subjects for cohorts 1 and 2
        result_path: imported_data/ # where to store imported data [immuneML implementation detail]
  encodings: # multiple encodings are defined that differ only on the p-value threshold they use to determine CMV-associated sequences
    enc01:
      SequenceAbundance:
        comparison_attributes: # how we define a sequence: as a combination of CDR3, V and J gene (as in the original publication)
          - sequence_aas
          - v_genes
          - j_genes
        p_value_threshold: 0.01
        sequence_batch_size: 1000000 # immuneML implementation details
        repertoire_batch_size: 150 # immuneML implementation details
    enc001: # second encoding with different p-value
      SequenceAbundance:
        comparison_attributes:
          - sequence_aas
          - v_genes
          - j_genes
        p_value_threshold: 0.001
        sequence_batch_size: 1000000
        repertoire_batch_size: 150
    enc0001:
      SequenceAbundance:
        comparison_attributes:
          - sequence_aas
          - v_genes
          - j_genes
        p_value_threshold: 0.0001
        sequence_batch_size: 1000000
        repertoire_batch_size: 150
    enc00001:
      SequenceAbundance:
        comparison_attributes:
          - sequence_aas
          - v_genes
          - j_genes
        p_value_threshold: 0.00001
        sequence_batch_size: 1000000
        repertoire_batch_size: 150
    enc000001:
      SequenceAbundance:
        comparison_attributes:
          - sequence_aas
          - v_genes
          - j_genes
        p_value_threshold: 0.000001
        sequence_batch_size: 1000000
        repertoire_batch_size: 150
  ml_methods: # here we define the classifier
    ml:
      ProbabilisticBinaryClassifier:
        max_iterations: 50000 # how many iterations are allowed while estimating the distribution parameters
        update_rate: 0.01
  reports:
    enc_data: DesignMatrixExporter # export encoded data in csv format
    sequence_association_likelihood: SequenceAssociationLikelihood # plot sequence association likelihood with estimated parameters
    feature_performance_plot: # show how performance changes depending on p-value threshold
      CVFeaturePerformance:
        feature: p_value_threshold
    sequence_overlap: # show if CMV-associated sequences overlap between CV folds
      DiseaseAssociatedSequenceCVOverlap:
        compare_in_selection: True
        compare_in_assessment: True
    relevant_sequences: RelevantSequenceExporter # export CMV-associated sequences
    emerson_reference_overlap: # check how many sequences overlap with the original study
      ReferenceSequenceOverlap:
        reference_path: emerson_reference.csv
        comparison_attributes:
          - sequence_aas
          - v_genes
          - j_genes
instructions:
  cmv_study_reproduction: # defines what analysis should be like
    reports: [feature_performance_plot, sequence_overlap, emerson_reference_overlap] # reports to run after nested CV is finished
    assessment: # outer loop of nested cross-validation: split manually to training (cohort 1) and test (cohort 2)
      split_strategy: manual
      split_count: 1
      manual_config:
        train_metadata_path: cmv_train_metadata.csv # cohort 1
        test_metadata_path: cmv_test_metadata.csv # cohort 2
      reports:
        encoding: [enc_data, relevant_sequences]
        models: [sequence_association_likelihood]
    selection: # inner loop of nested cross-validation performing 10 cross-validation to choose best p-value threshold
      split_strategy: k_fold
      split_count: 10
      reports:
        encoding: [enc_data, relevant_sequences]
    number_of_processes: 32
    dataset: cmv2017
    labels: # which labels to use from the metadata, here: CMV
    - CMV:
        positive_class: True # positive class is called "True" - implementation detail used for encodings and some reports
    optimization_metric: log_loss # which metric to use for choose the best encoding
    metrics: # additional metrics to compute
    - balanced_accuracy
    - auc
    strategy: GridSearch # try out all settings combinations (all encodings here)
    type: TrainMLModel # name of the instruction
    refit_optimal_model: True # whether to refit the data on the whole dataset when all training and testing is finished
    settings: # combinations of encodings and classifiers to try out, basically, just listing all encodings with different p-values
    - encoding: enc01
      ml_method: ml
    - encoding: enc001
      ml_method: ml
    - encoding: enc0001
      ml_method: ml
    - encoding: enc00001
      ml_method: ml
    - encoding: enc000001
      ml_method: ml
output:
  format: HTML # output the result as HTML
Robustness assessment
After reproducing the study, we also assessed the robustness of the method on smaller datasets. To do that, we first constructed smaller datasets, and and then reproduced the analysis on those smaller datasets.
Constructing subsampled datasets
To construct smaller datasets of 400, 200, 100 and 50 subjects randomly from both cohorts, we used Subsampling instruction with the following YAML specification.
subsample_datasets.yaml
definitions:
  datasets:
    cmv2017: # we import the full dataset with 683 subjects as it was imported previously in immuneML-optimized format
      format: ImmuneML
      params:
        path: imported_data/cmv2017.yaml # Note that in older versions of immuneML (<3), immuneML datasets had .iml_dataset extension instead of .yaml
instructions:
  subsampling_inst: # user-defined name of the instruction
    type: Subsampling # which instruction to execute
    dataset: cmv2017 # original dataset to be subsampled
    subsampled_dataset_sizes: # how large the subsampled datasets should be, one dataset will be created for each list item
      - 400
      - 200
      - 100
      - 50
    dataset_export_formats: # in which formats to export the subsampled datasets
      - ImmuneML
Running the analysis on subsampled datasets
To analyze and compare performances on datasets of different sizes, we use MultiDatasetBenchmarkTool.
The MultiDatasetBenchmarkTool can be run from the command line by providing the tool parameter in addition to YAML specification and the resulting folder:
immune-ml robustness_assessment_specs.yaml robustness_assessment_result/ --tool MultiDatasetBenchmarkTool
The YAML specification is mostly the same as when only TrainMLModel instruction is used except:
the dataset parameter is now called datasets and accepts a list of datasets on which the TrainMLModel instruction has to be performed (format and functionality are the same as described under reproduction), and
it has one additional parameter called benchmark_reports that will be executed after all datasets have been used to compare performances.
The YAML specification is given below.
robustness_assessment.yaml
definitions:
  datasets: # datasets for assessing robustness
    cmv2017_400: # with 400 repertoires
      format: ImmuneML
      params:
        path: subsampled_datasets/subsampling_inst/cmv2017_400_subsampled_1/exported/immuneml/cmv2017_400_subsampled_1.yaml # Note that in older versions of immuneML (<3), immuneML datasets had .iml_dataset extension instead of .yaml
    cmv2017_200: # with 200 repertoires
      format: ImmuneML
      params:
        path: subsampled_datasets/subsampling_inst/cmv2017_200_subsampled_2/exported/immuneml/cmv2017_200_subsampled_2.yaml
    cmv2017_100: # with 100 repertoires
      format: ImmuneML
      params:
        path: subsampled_datasets/subsampling_inst/cmv2017_100_subsampled_3/exported/immuneml/cmv2017_100_subsampled_3.yaml
    cmv2017_50: # with 50 repertoires
      format: ImmuneML
      params:
        path: subsampled_datasets/subsampling_inst/cmv2017_50_subsampled_4/exported/immuneml/cmv2017_50_subsampled_4.yaml
  encodings: # encodings as in Emerson et al. 2017 with different p-values to discover disease-associated combination of amino acid sequence and V and J gene
    enc01:
      SequenceAbundance:
        comparison_attributes:
          - sequence_aas
          - v_genes
          - j_genes
        p_value_threshold: 0.01
        sequence_batch_size: 1000000 # implementation details not affecting the algorithm, only the speed
        repertoire_batch_size: 150 # implementation details not affecting the algorithm, only the speed
    enc001:
      SequenceAbundance:
        comparison_attributes:
          - sequence_aas
          - v_genes
          - j_genes
        p_value_threshold: 0.001
        sequence_batch_size: 1000000
        repertoire_batch_size: 150
    enc0001:
      SequenceAbundance:
        comparison_attributes:
          - sequence_aas
          - v_genes
          - j_genes
        p_value_threshold: 0.0001
        sequence_batch_size: 1000000
        repertoire_batch_size: 150
    enc00001:
      SequenceAbundance:
        comparison_attributes:
          - sequence_aas
          - v_genes
          - j_genes
        p_value_threshold: 0.00001
        sequence_batch_size: 1000000
        repertoire_batch_size: 150
    enc000001:
      SequenceAbundance:
        comparison_attributes:
          - sequence_aas
          - v_genes
          - j_genes
        p_value_threshold: 0.000001
        sequence_batch_size: 1000000
        repertoire_batch_size: 150
  ml_methods:
    ml:
      ProbabilisticBinaryClassifier: # classifier as described in Emerson et al. 2017
        max_iterations: 50000
        update_rate: 0.01
  reports:
    enc_data: DesignMatrixExporter # export encoded data as a csv file, also export labels and other info
    sequence_association_likelihood: SequenceAssociationLikelihood
    feature_performance_plot: # show how performance changes on average for different p-value thresholds for determining disease-associated sequences
      CVFeaturePerformance:
        feature: p_value_threshold
        is_feature_axis_categorical: True
    sequence_overlap: # check how stable are the estimates of disease-associated sequences across folds
      DiseaseAssociatedSequenceCVOverlap:
        compare_in_selection: True # compare disease-associated sequences only for the chosen optimal model across CV folds
        compare_in_assessment: True
    relevant_sequences: RelevantSequenceExporter # export disease-associated sequences
    emerson_reference_overlap: # check how much discovered disease-associated sequences overlap with the results published in the paper
      ReferenceSequenceOverlap:
        reference_path: emerson_reference.csv
        comparison_attributes:
          - sequence_aas
          - v_genes
          - j_genes
    sequence_overlap_across_datasets: DiseaseAssociatedSequenceOverlap # check how much disease-associated sequences overlap across datasets of different size
    performance_report: PerformanceOverview # show AUROC, AUPRC across datasets
instructions:
  cmv_study_reproduction: # the format of the instruction is the same as above except there is a parameter benchmark_reports which are run when the instructions have finished
    reports: [feature_performance_plot, sequence_overlap, emerson_reference_overlap] # reports to run after nested CV is finished
    benchmark_reports: [sequence_overlap_across_datasets, performance_report] # reports to run after all dataset have been benchmarked
    assessment: # nested 5-fold CV (outer loop)
      split_strategy: k_fold
      split_count: 5
      reports:
        encoding: [enc_data, relevant_sequences]
        models: [sequence_association_likelihood]
    selection: # nested 5-fold CV (inner loop)
      split_strategy: k_fold
      split_count: 5
      reports:
        encoding: [enc_data, relevant_sequences]
    number_of_processes: 32
    datasets: # instead of one dataset, there are 4 now when we use MultiDatasetBenchmarkTool
      - cmv2017_400
      - cmv2017_200
      - cmv2017_100
      - cmv2017_50
    labels:
    - CMV:
        positive_class: True
    metrics:
    - balanced_accuracy
    - auc
    optimization_metric: log_loss
    strategy: GridSearch # try out all combinations of encoding and ml_method listed under settings
    type: TrainMLModel # the type of the instruction which will be executed for each dataset
    refit_optimal_model: False
    settings: # combinations to try out to choose the best p-value
    - encoding: enc01
      ml_method: ml
    - encoding: enc001
      ml_method: ml
    - encoding: enc0001
      ml_method: ml
    - encoding: enc00001
      ml_method: ml
output:
  format: HTML
Results
The results of reproducing the study by Emerson et al. are shown in the following figure:
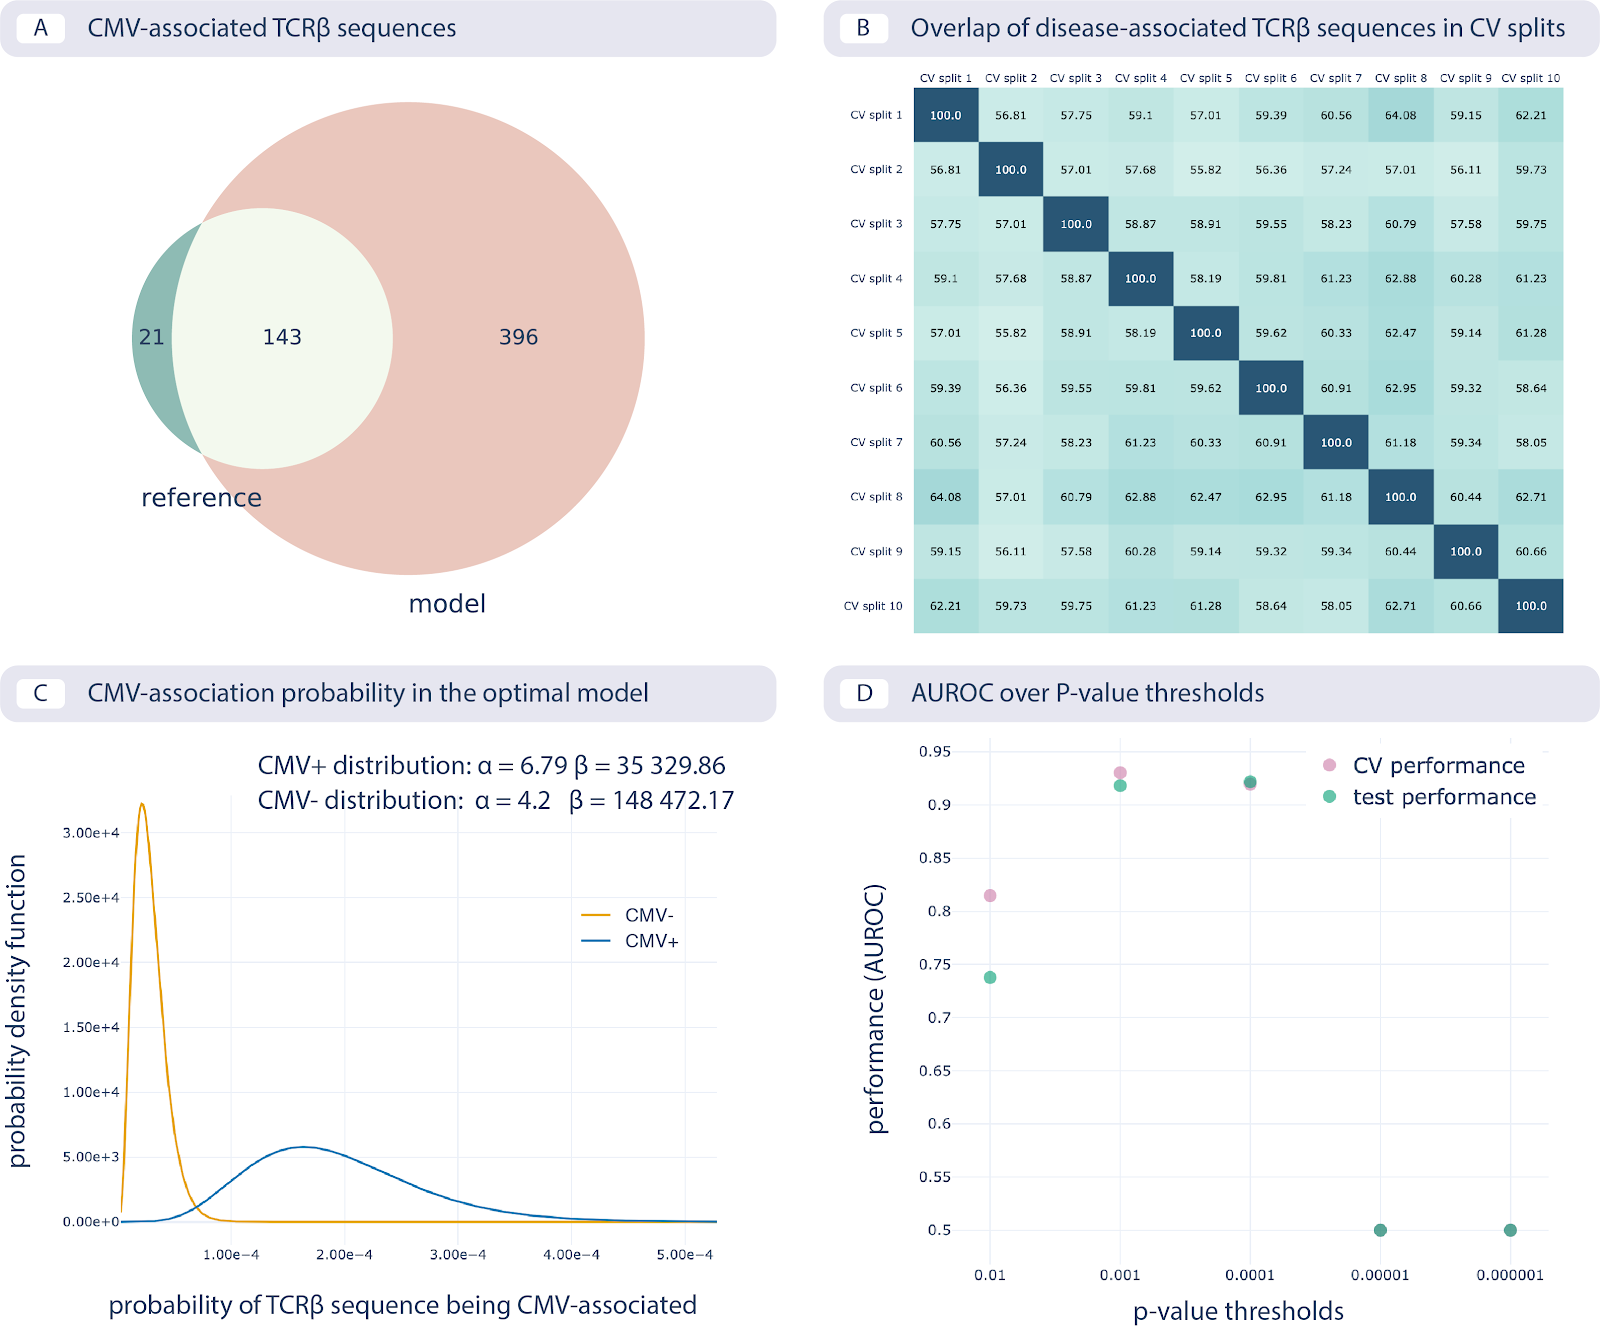
Reproducing the CMV status prediction study by Emerson et al.5 A. The overlap of the 164 disease-associated TCRβ sequences (V-TCRβaa-J) determined in the original study by Emerson et al., labeled “reference”, with those determined by the optimal model as reproduced here with a p-value threshold of 0.001 (labeled “model”). B. The overlap percentage of disease-associated TCRβ sequences for the optimal model with the p-value threshold of 0.001 between different data splits in 10-fold cross-validation (between 50% and 65% overlap). C. The probability that a TCRβ sequence is CMV-associated following a beta distribution estimated separately for CMV positive and negative subjects, which is then used for CMV status prediction of new subjects. D. Area under the ROC curve (AUROC) over p-value thresholds in training data (average AUROC over 10 cross-validation splits) and test data (AUROC in cohort 2).
Furthermore, the results of the robustness assessment (reproducing the study with a lower number of repertoires) are show here:
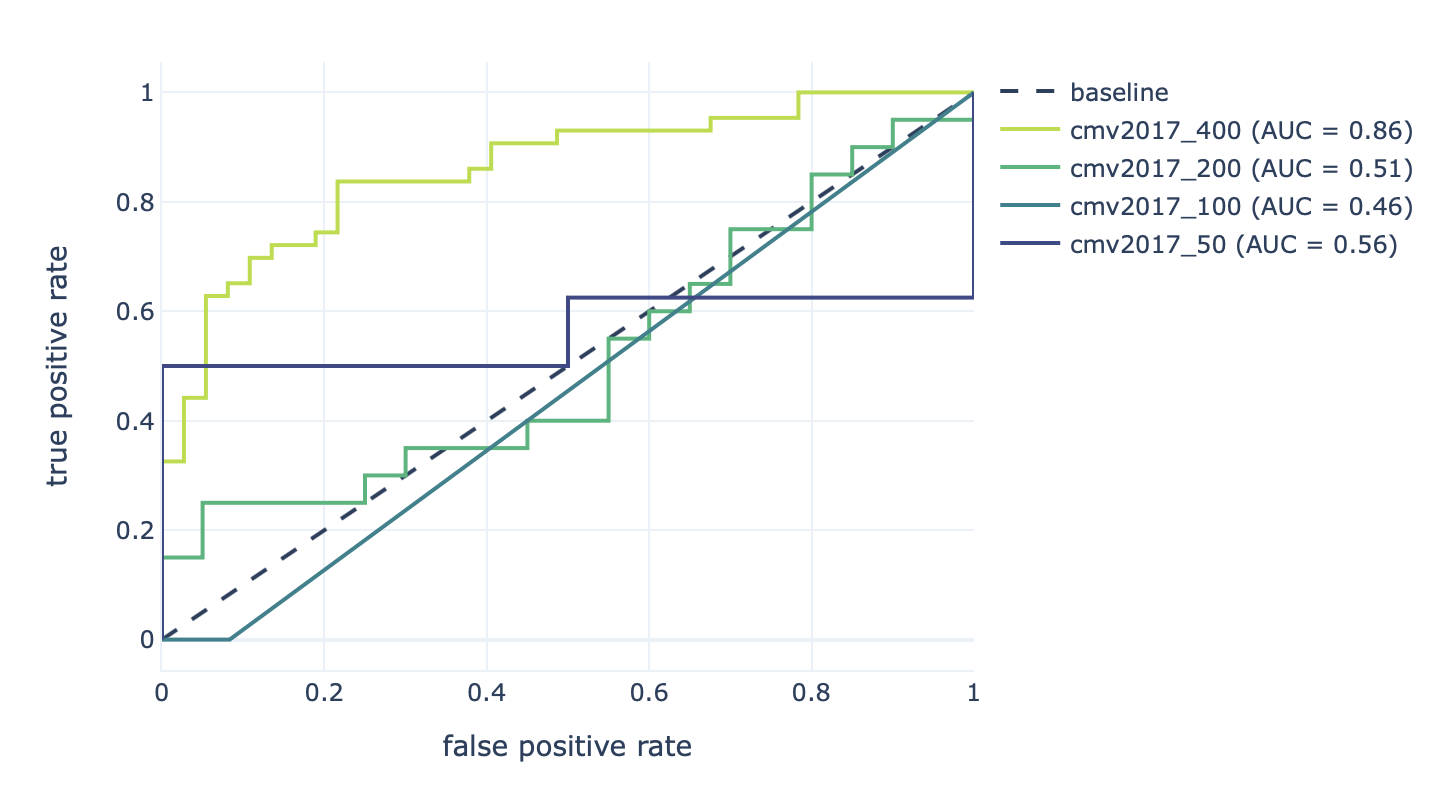
Decreasing the number of repertoires (400, 200, 100, and 50) leads to decreased prediction accuracy (AUROC: 0.86–0.46).