Discovering motifs learned by classifiers
KmerFrequency coefficients
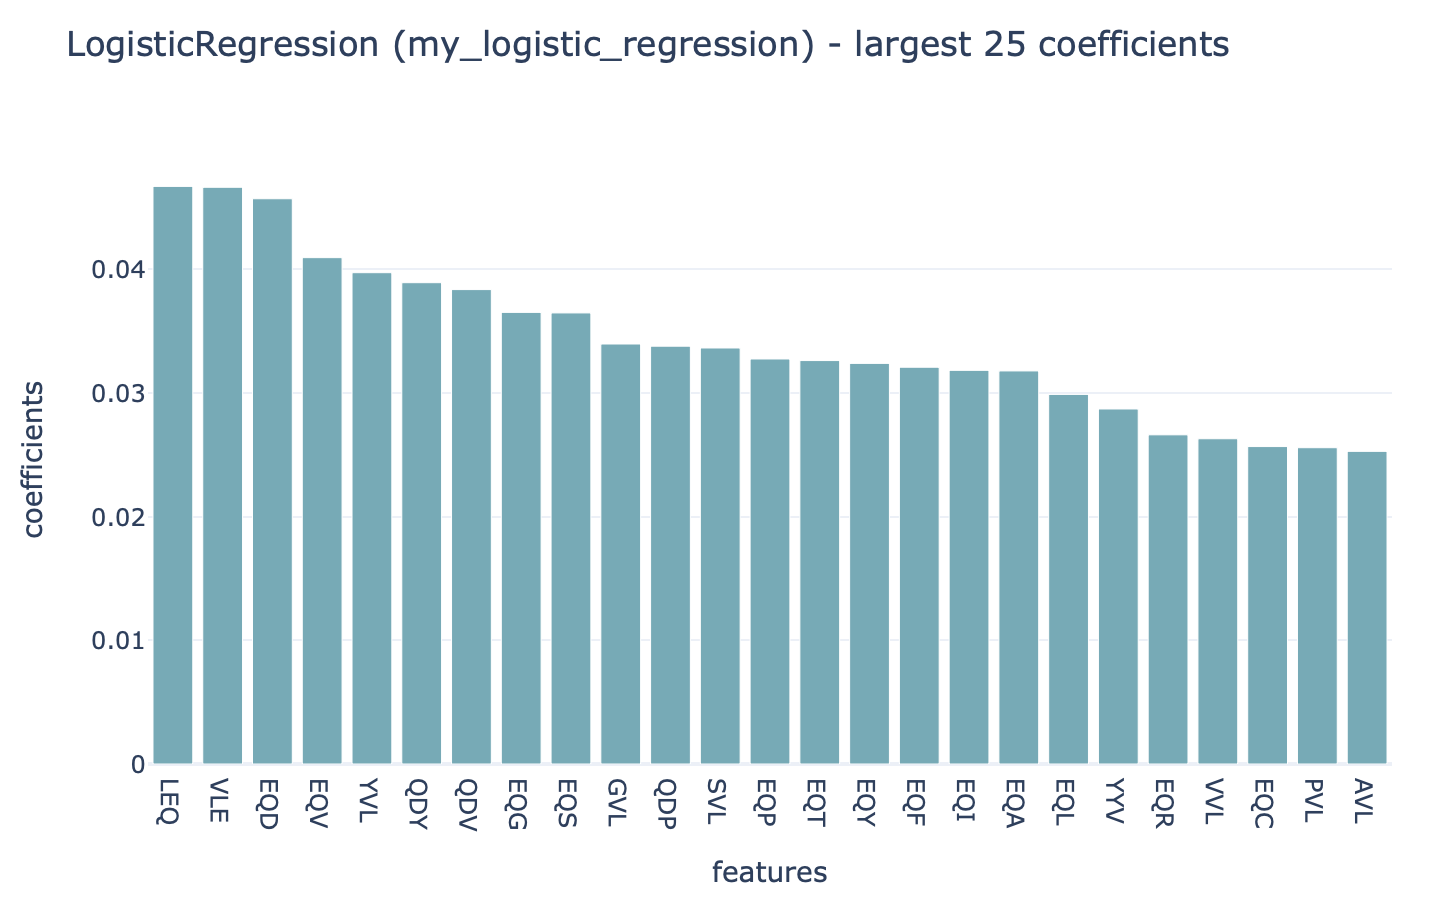
When using the KmerFrequency encoder in combination with LogisticRegression, SVM or RandomForestClassifier, a straightforward way to investigate which k-mer subsequences were learned to be important is by running the Coefficients report. To specify this type of analysis, see How to train and assess a receptor or repertoire-level ML classifier, where the Coefficients reports can be provided under TrainMLModel instruction, under selection:reports:models or assessment:reports:models. This can be applied to repertoire, receptor and sequence classification problems.
Strongly positive coefficients might indicate (partial) disease or antigen specificity-associated motifs. Consider the following example, where the ground truth implanted disease signal was ‘VLEQ’, the largest 3-mer encoding coefficients are associated with the subsequences ‘VLE’ and ‘LEQ’ which are contained inside ‘VLEQ’. Furthermore, subsequences that partially overlap with the disease signal, such as ‘EQD’, ‘EQV’ and ‘YVL’ are also associated with relatively large coefficients. Note that the coefficient size is not only determined by how important a subsequence is for determining an immune state or antigen specificity, but also other factors, such as the baseline frequency of subsequences in a dataset.
DeepRCMotifDiscovery for repertoire classification
When using the classifier DeepRC for a repertoire classification task, the report DeepRCMotifDiscovery can be used to investigate the learned patterns in the data. This report plots the contributions of input sequences and kernels to trained DeepRC model. These contributions are computed using integrated gradients (IG). The following two figures show examples of the DeepRCMotifDiscovery report outputs when training a DeepRC model on a dataset containing the artificial disease signal ‘VLEQ’. See How to train and assess a receptor or repertoire-level ML classifier for tutorial on how to write an instruction to perform this type of analysis (using TrainMLModel instruction and specifying the report under selection:reports:models or assessment:reports:models) and DeepRCMotifDiscovery for more information on the specific report.
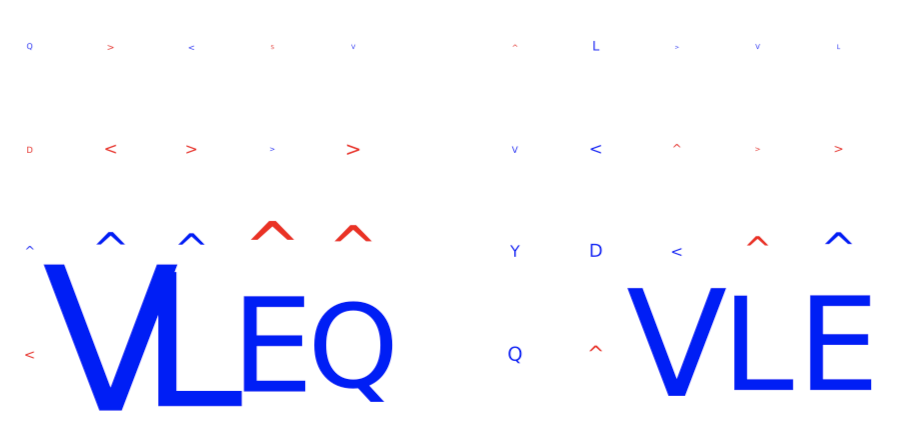
The left figure shows the contributions of the characters within the input sequences of the test dataset for the immune status prediction of the repertoire. Blue indicates positive contribution, while red indicates negative contribution. Similarly, the right figure shows the 1D CNN kernels with the highest contribution over all positions and amino acids.
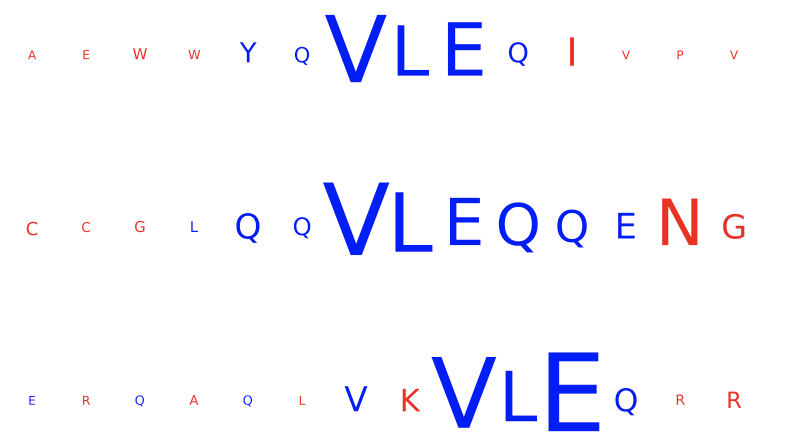
In this example, one kernel shows a strong signal for the subsequence ‘VLEQ’ while another shows a strong signal for ‘VLE’, which results in a strong positive contribution for the subsequence ‘VLE’ in the input sequences, with a relatively smaller (but still posxitive) contribution from the remaining ‘Q’.
TCRdistMotifDiscovery for receptor classification
For paired receptor datasets, the ML method TCRdistClassifier can be used in combination with the TCRdistMotifDiscovery report. This report hierarchically clusters paired immune receptor sequences based on the TCRdist3 distance metric, and for each of the clusters logo plots are created to uncover the motifs within the clustered receptors. See How to train and assess a receptor or repertoire-level ML classifier for running the TrainMLModel instruction (where TCRdistMotifDiscovery report can be provided under assessment:reports:models or selection:reports:models), and TCRdistMotifDiscovery report for more details on the report.
The figures below show examples of the logo plots of the TCRα (left) and TCRβ (right) chains. In this example, the subsequence ‘VLEQ’ has been implanted in the TCRβ chains, which can be seen in positions 4-7 in the logo plot on the right.

